Pages

Showing posts with label Maths. Show all posts

Thursday, 8 September 2016

Survey Response


WALHT: Write a survey using Google form 
  • Use the feedback to create and display that data in a pie graph 
  • analyse the results 
Screenshot 2016-09-06 at 10.16.41 AM.png

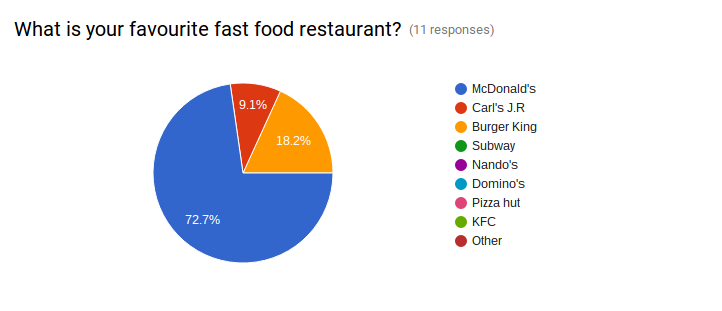
This graph shows that 72.7% of people choose McDonald's since it is their favourite fast food restaurant with Carl’s Jr. at 9.1% and Burger King at 18.2% (out of 11 people).

Screenshot 2016-09-06 at 10.17.45 AM.png
From people that voted most of them like strawberry and chocolate the best, because they both have 28.6% votes, followed by Hokey Pokey with 21.4%, Vanilla with 14.3% and Cookie’s n Cream with 7.1%
Screenshot 2016-09-06 at 10.20.55 AM.png

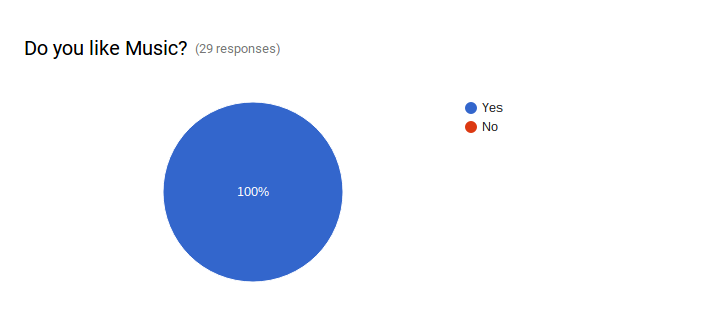
This graph shows that all the people like music.

Monday, 29 August 2016

Maths time-span graph


This graph above shows how much rain fell in the past week. On Monday and Wednesday it shows that no rain fell, but on Tuesday it rained 7mm.


This graph above shows that Emily had not gained weight (Muscle)  in January to February but over the following months she did. Her weight gain between from 40 to 49kg.


This data above shows that William increased his speed of typing 300 words in 6 weeks.

Walht: Create graphs using a spreadsheet and to analyse data in those displays